Overview
School on Wheels Massachusetts (SOWMA) is a nonprofit that provides tutoring and educational support to children experiencing homelessness. Before this project, their staff had to manually switch between Google Analytics, Meta Business Suite, and other platforms just to pull together a basic report — fragmented data, fragmented picture.
As Project Manager for JumboCode (Tufts University's pro-bono software club), I led a team of 10 student developers over two academic semesters to design and deliver a centralized analytics dashboard for SOWMA, giving their staff a single place to monitor outreach and engagement across all their digital platforms.
What We Built
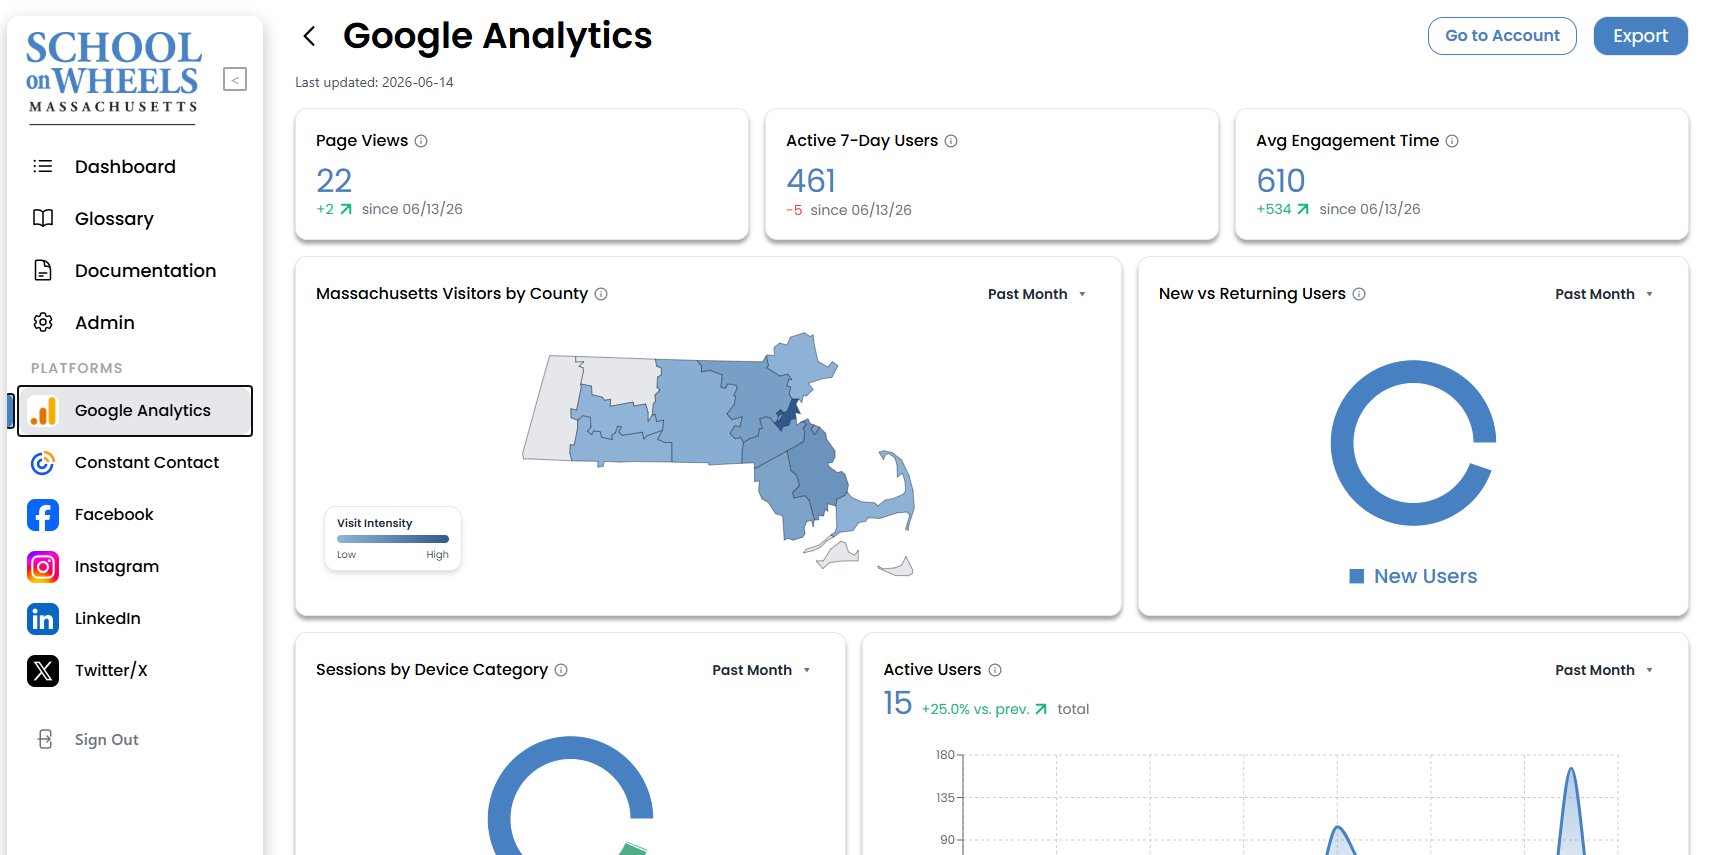
- Unified dashboard aggregating Google Analytics, Facebook, Instagram, and Twitter metrics
- Historical metric storage so SOWMA can track trends over time, not just snapshots
- Interactive charts, metric cards, and date-range filtering
- Export-to-PDF for stakeholder reports
- Role-based access control (Admin, User, Viewer) for different staff members
- Automated data refresh jobs via GitHub Actions
My Role
I owned the full project lifecycle — scoping requirements with the nonprofit client, running sprint planning, unblocking developers, and managing sponsor communication throughout the year. The project shipped on time with all acceptance criteria passing.
Tech Stack
- Frontend: React + TypeScript, Tailwind CSS, Vite
- Backend: Node.js + Express
- Database/ORM: PostgreSQL (Neon) + Prisma
- Auth: Clerk
- Integrations: Google Analytics API, Meta APIs (Facebook, Instagram, Twitter)
- Deployment: Vercel + GitHub Actions
Code
Link to GitHub.